

Overview
Two things in Connect can be exported, and they behave differently. For anything you need on a schedule, the API is the better route — see When to use the API instead.Charge detail records
One row per completed session, with 50-plus columns of context. Generated in the background and collected from the Exports page.
Dashboard
The figures behind the Dashboard’s period metrics, one row per connector per day. Downloads straight away.
Charge detail record exports
A charge detail record export is the same population you see on the Charge detail records page, written to a CSV. Because a CDR carries the location, driver, tariff, and pricing context around each session, one file can serve reconciliation, employee reimbursement, utilisation analysis, and sustainability reporting without you joining it to anything else.Filtering before you export
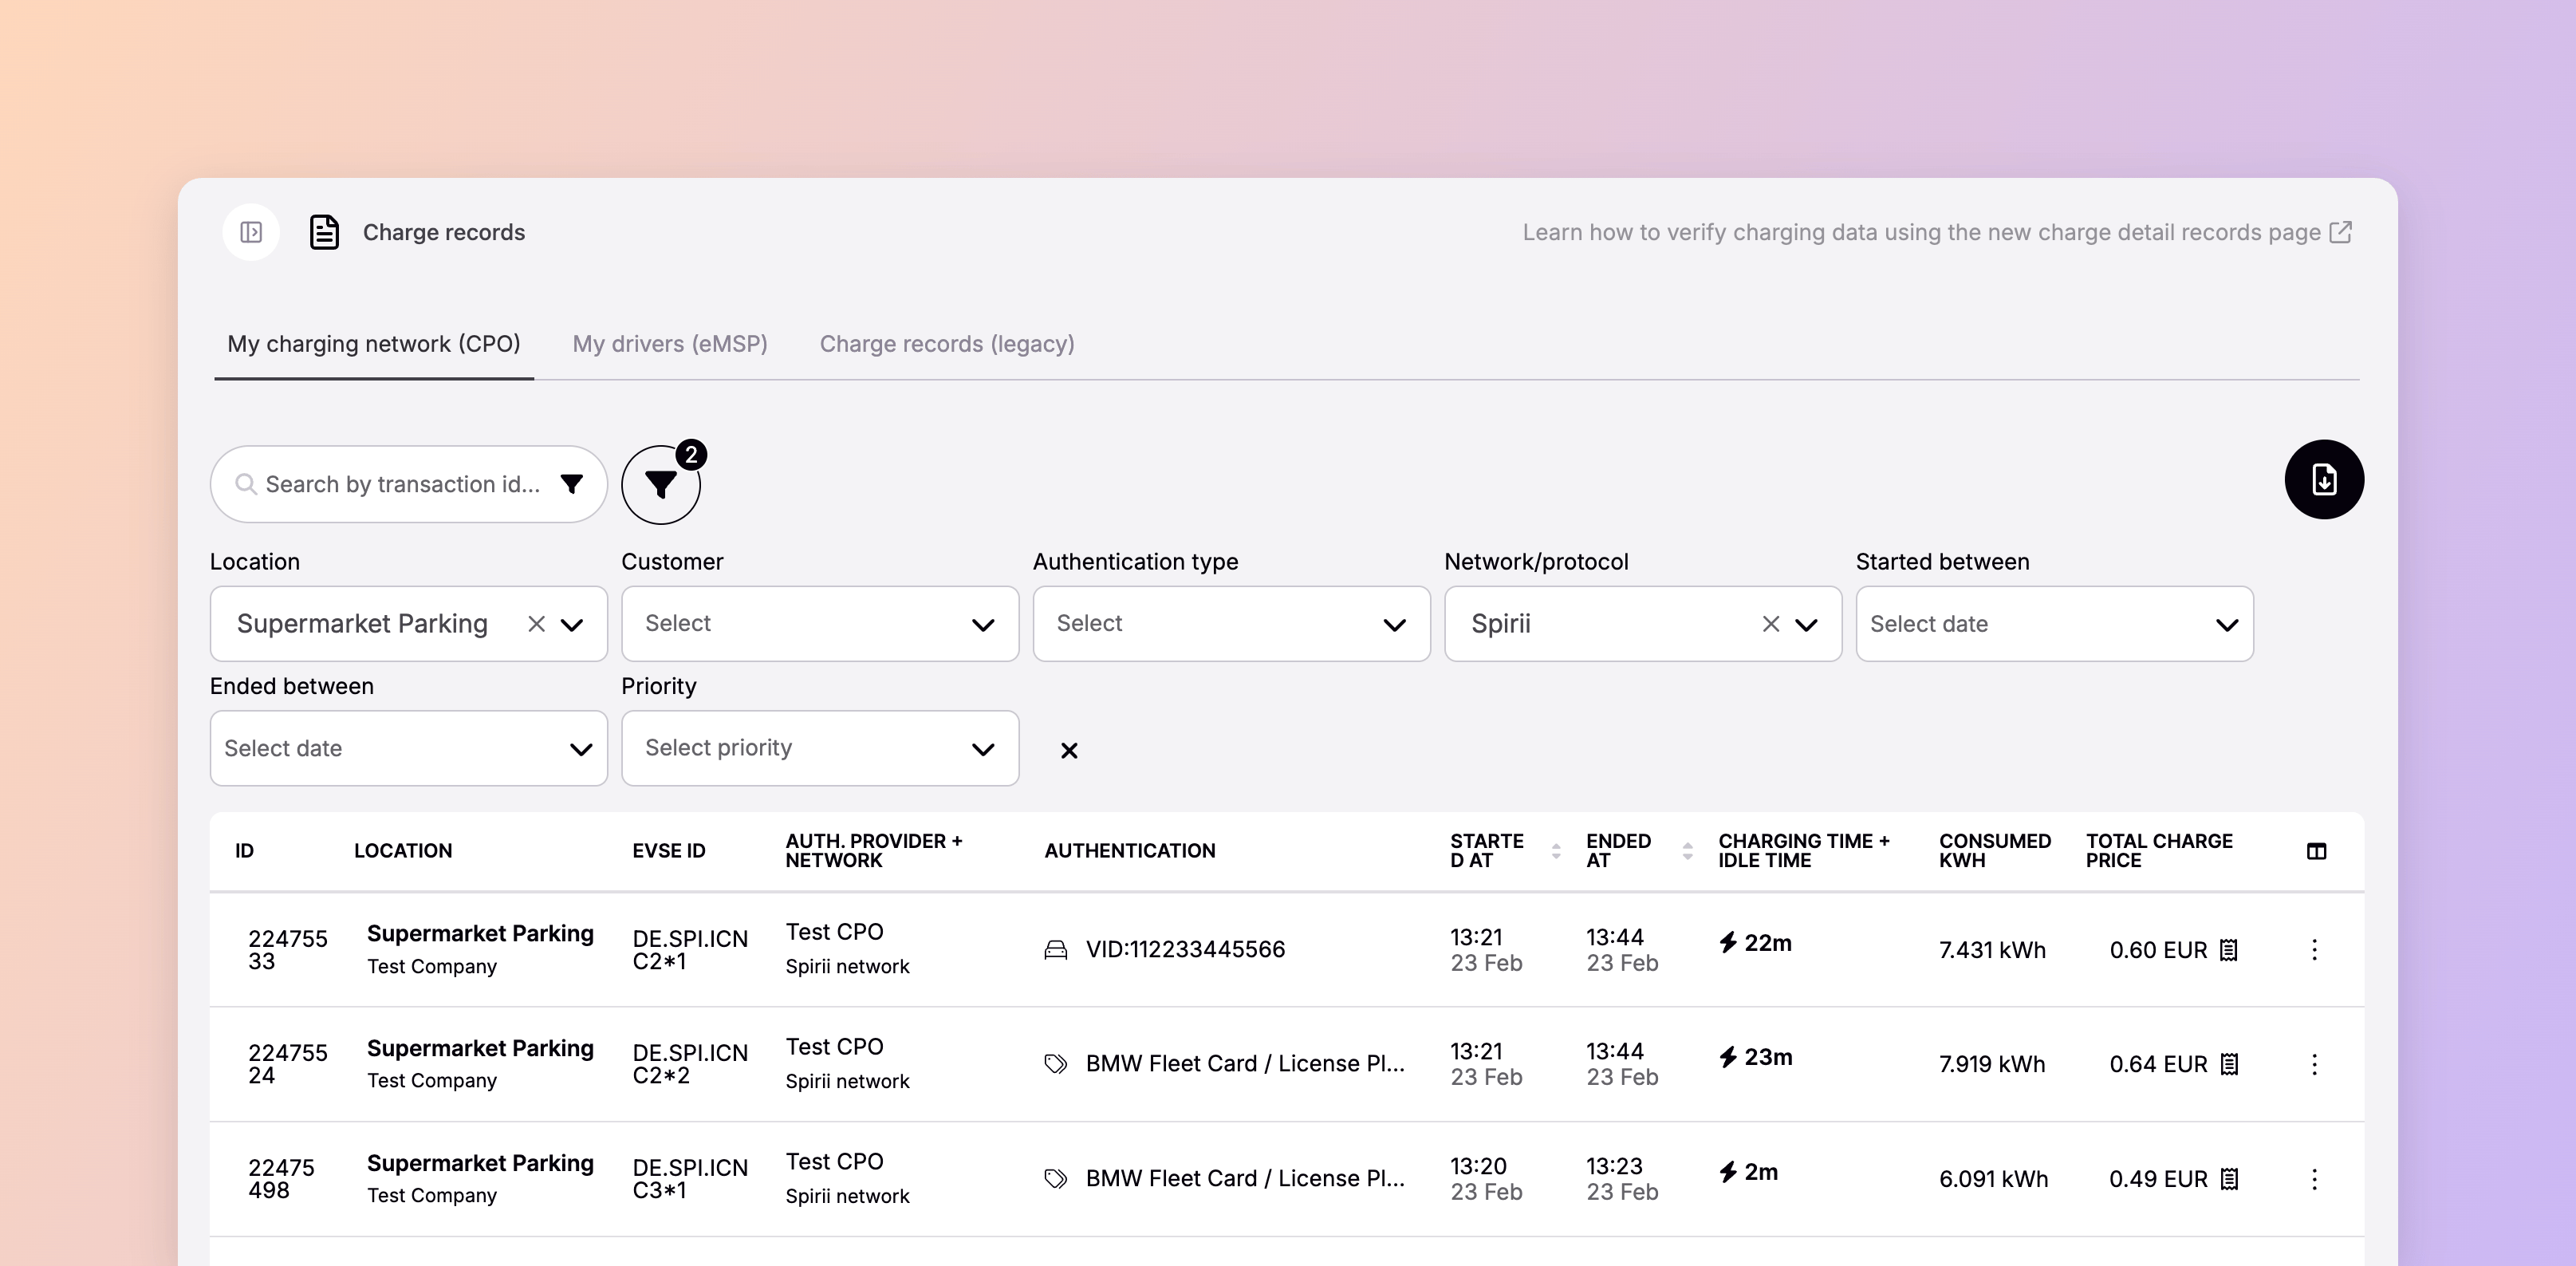
The export inherits the filters currently set on the page, so narrow the view first. The filters differ depending on which side of the business you are looking at.- Your charging network
- Your drivers
- Location
- Customer
- Authentication type
- Network
- Started between
- Ended between
- Priority
Exporting from a single location, charge key, or app user
The Charge detail records tab also appears on individual location, charge key, and app user pages. Exporting from there gives you only that entity’s sessions, which is the quickest route to a single driver’s reimbursement claim or one site’s monthly figures.Choosing the field delimiter
Before the export runs you choose the field delimiter. This is a locale setting: pick the one your spreadsheet expects and the file opens in columns.Following an export
CDR exports are generated in the background. Small ones finish in seconds; a quarter or a year of data across a large network takes a few minutes. Find them under your name at the bottom of the menu, then Exports. The table lists each export with its generation status, creation date, the operator or company it covers, the filename, the file type, the file size, and a download button once it is ready. The page refreshes every ten seconds, so the percentage counter advances while the file builds.What a CDR export contains
Each row is one completed session. The columns fall into eight groups.Session identity
Session identity
The record’s own ID, plus the EVSE and charge box it ran on. These are what you join against if you are combining the export with data from elsewhere.
Location and owner
Location and owner
The location’s ID, name, address, and type, whether it is public, and the customer that owns it — including that customer’s billing reference and CRM identifier. Also the operator network and operator name behind the site.This is the group that lets you split a report by site, by customer, or by the entity you invoice.
Who charged
Who charged
The authentication type, and then the identifiers behind it: the app user, the charge key’s UID, its label and comment, and the billing customer the charge key belongs to with its own reference and CRM identifier.Also the authentication provider and provider network, which say whose driver it was, and a flag for whether Spirii treated the session as roaming.
Timing
Timing
When the session started, ended, and was created, along with charging time and idle time in seconds.Charging time and idle time are separate columns, so you can tell a slow session from a car left plugged in after it finished.
Energy and vehicle
Energy and vehicle
Meter start and end values, total consumed, and maximum power reached. Where the charge box reports it, the vehicle’s state of charge at the start and end of the session.
Price and VAT
Price and VAT
Total price including and excluding VAT, the VAT rate and amount, and the currency. Alongside them, the payment method and payment status.The VAT split is already calculated, so a finance team does not have to derive it.
Tariff and discounts
Tariff and discounts
The name of the tariff applied, whether it was dynamic, and the roaming tariff identifier where one applied. Where a voucher was used, its group and ID.
Fee breakdown
Fee breakdown
The component fees that produced the total: energy fees with the consumption and price behind each, time fees with the minutes and price behind each, and any flat fees.This is where you show a customer how a price was arrived at, rather than only what it came to.
Reading a charge detail record export
Four things are worth knowing before you build anything on top of the file.- Blank and zero mean different things. A blank cell means the value does not apply to that row. A
0is a measured value and belongs in a sum. - Fee columns can hold several values in one cell. Where a tariff has multiple components, the values are separated by a pipe inside the cell, like
2,544 | 4,895 | 4,624. Split on the pipe before you total anything. - Timestamps use one timezone. They are written in central European time, with the timezone included. They are not converted to each location’s local time, so if you are analysing time of day across markets, shift them first.
- The roaming flag reflects Spirii’s view, not yours. It marks whether a session arrived through an external roaming provider or from inside Spirii’s own ecosystem, which means a driver belonging to a different Spirii operator is not flagged as roaming. To separate your own drivers from visitors, compare the authentication provider against your own operator name rather than reading that column.
Dashboard exports
The Dashboard export writes out the figures behind the page’s period metrics, at a finer grain than the page shows them. One row covers one connector on one day, using the filters and time range currently set.
Because the grain is a connector-day, the file answers questions the page cannot: which connector underperformed last Tuesday, how utilisation varies across one site, how a single customer’s estate trended over a month. Group the rows however your question needs.
A connector that took no sessions shows 100% uptime, which follows from how the metric is defined.
Two things the file does not carry. The comparison against the previous period is calculated in the view, so recompute it from the dates if you need it. And the daily grain cannot reproduce the heatmap’s hour-of-day pattern — that needs session start and end times from a charge detail record export.
Dates are written in ISO form here, where a charge detail record export uses day-first timestamps, so watch the format if you combine the two files.
The delimiter is not selectable here: Dashboard exports are always semicolon-delimited. These files are small, so they download in your browser straight away.
When to use the API instead
A manual export suits a question you are answering once, or a report someone assembles by hand each month. For anything recurring, the charge detail records API is the better route. It returns the same session data as a feed you can schedule, which is how partners build their own dashboards, reconcile automatically, and drive billing without anyone opening Connect.Dependencies & limitations
- Large exports take time. There is no cap on what you can request, but a year of data across a large network takes minutes rather than seconds.
- Only CDR exports queue. The Exports page lists charge detail record exports. Dashboard exports download immediately and do not appear there.
- The export mirrors your filters exactly. Anything excluded by a filter is absent from the file, so set the filters before you export.
- Installer and Depot Manager roles cannot export. Every other role can.
Related
If you are exporting for the first time, set your filters before you start. The file is built from whatever the page is showing.Sessions and CDRs
What a charge detail record is, and when it becomes final.
Dashboard
The aggregated view these figures are drawn from.
Charge detail records API
The same session data as a feed, for recurring reporting.
Roles
Which roles in your organisation can export.